Nutrient density
 Nutrient Density
What it Nutrient Density?
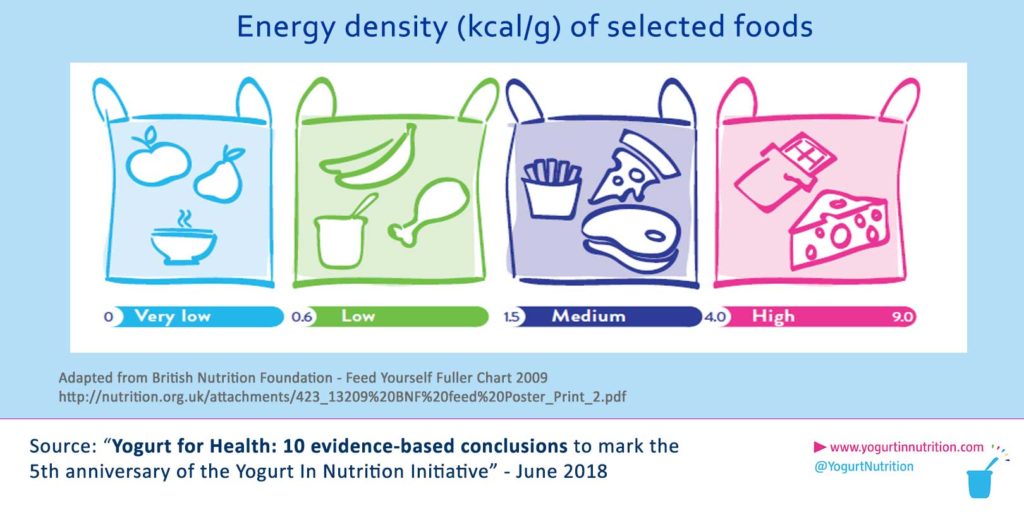
The Nutrient density is a measure, for a food product, of the quantity of nutrients provided per calorie of food (1). It is a way to show the concentration of nutrients per amount of food or the caloric contribution of that food. Nutrient-dense food will provide higher concentration macro and micro-nutrients to encourage (like proteins, fibers, vitamins, minerals…) relative to calories.
Nutrient-dense foods can be opposed to energy-dense foods, providing a huge number of calories per gram of food, mainly due to their quantity of nutrients to limit (i.e. added-sugar or trans-fat).
How is assessed Nutrient Density?
The nutrient density assessment is a kind of nutrient profiling of foods. With that, it allows a ranking of food products based on their nutritional composition. This nutrient profiling remains a statistical approach to rank foods.
The assessment is generally based on the content of key nutrients per 100g, 100 kcal or per serving size and the calculation is based on public nutrient composition data (1,6).
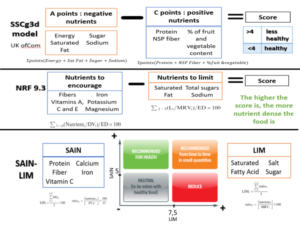
There are many different raking system that can be used to assess the nutrient density of foods, for example:
- The SSCg3d model (UK) gives a single score based on a set of “negative” indicators (energy, saturated fat, sugar and sodium) counter-balanced by a score based on “positive” indicators (protein, fiber, fruit, vegetables and nuts). A score below 4 will pinpoint more healthy food to promote.
- The NRF or Nutrient-Rich Foods index (USA) (1) is based on the balance of beneficial nutrients and nutrients to limit. The NRF9.3 index is based on 9 nutrients to encourage (protein, fiber, vitamins A, C, and E, calcium, iron, potassium, magnesium) and 3 nutrients to limit (saturated fat, added sugar, sodium) per 100 calories of portions. Higher NRF9.3 scores is associated with lower energy density and more nutrient-rich diets.
- The SAIN/LIM system (France) (2) is based on two scores. The SAIN is a score of nutritional adequacy based on the content of 5 nutrients (protein, fiber, vitamin C, calcium, iron) + 4 potential optional nutrients. The LIM score is a mean percentage of the maximum recommended values for nutrients that should be limited in a healthy diet: saturated fats, added sugars and salt. A high SAIN score is associated to nutrient-rich foods. It allows the allocation of each food into one of four different classes: 1. Recommended for health / 2. Recommended from time to time in small quantities/ 3. Neutral /4. Reduce
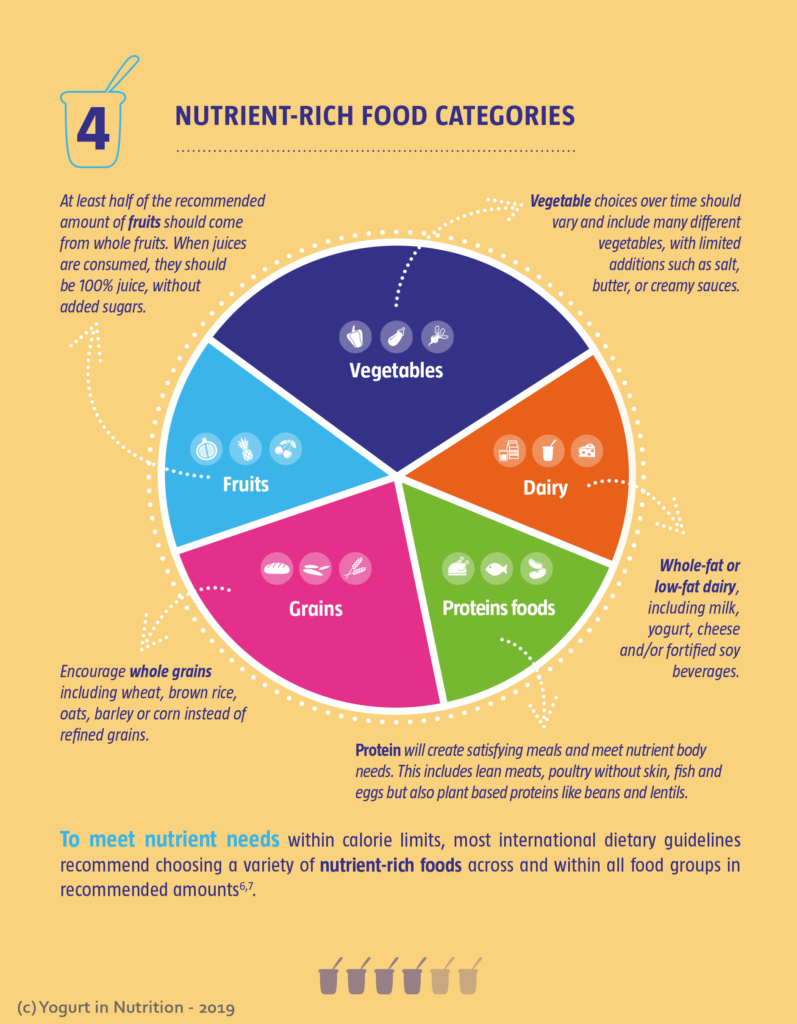
Top 10 of the most nutrient-dense food groups
The most nutritious or nutrient-dense foods are classified in several food groups:
- Vegetables
- Fruits
- Whole grains
- Beans
- Seafood,
- Eggs
- Low-fat dairy products
- Lean meat and poultry
Those products mainly bring nutrients to encourage (proteins, fibers, vitamins, minerals…).
How nutrient density may help?
Favouring high nutrient dense foods may help you reach nutritional adequacy (4).
With nutrient-rich food, calcium content, bioactive lipids, satiating and bioactive peptides, and nutrient density at large are related to weight control, bone health, and cardiovascular health.
Therefore, in regard to the selection of food products, the balance should go for nutrient-dense foods. For example, nutrient-dense food can be very valuable alternative when it goes to snacking. Some studies show actually that the consumption of products like milk, yogurt, fruits, nuts or seeds can be very valuable alternative to standard consumed snacks (like sugar drinks, ice cream, candies etc.) (4).
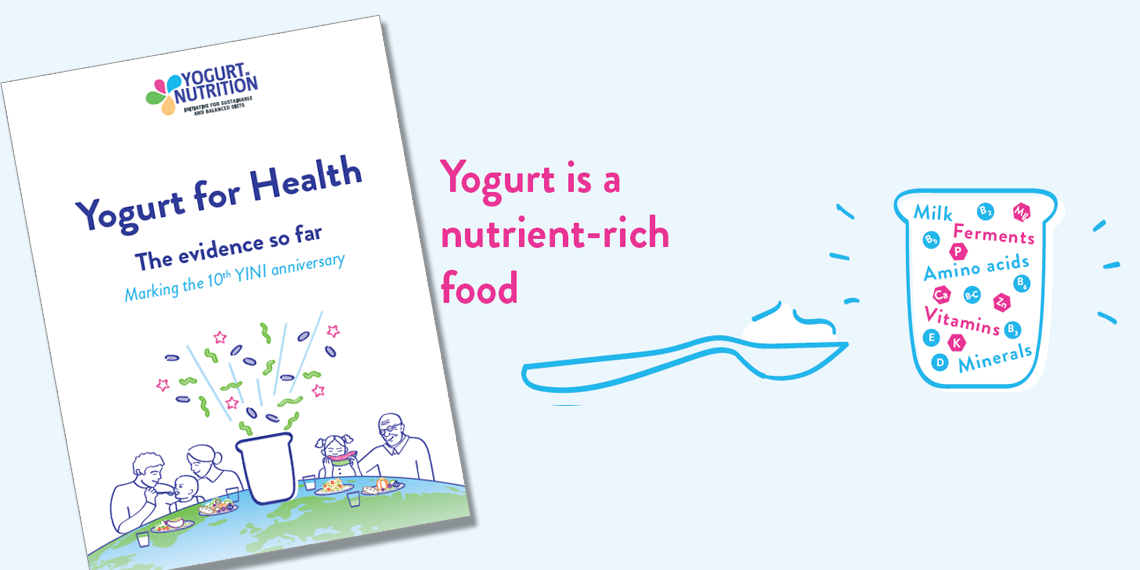
Is yogurt a nutrient-dense food?
Yogurt is a nutrient-dense food with a NRF Score of 55,3 (to compare, fruit has an average score of 30,1, where carbonated drinks, one of the less nutrient-dense food category have a score of -17,2) (3).
Yogurt provide high amount of interesting nutrients to encourage: protein, calcium, potassium, magnesium. The dairy proteins brought by the yogurt provide a valuable mix of amino acids (including all of the 9 essential amino acids) and have a good bioavailability (well digested and absorbed).
In the yogurt production, the nutritional value of dairy proteins remains preserved during the fermentation process and studies shows that yogurt’s proteins are even more digestible than the proteins in standard milk. It seems that the heat treatment and the acid production involved in the fermentation process help breaking down the dairy proteins. Its produces smaller, easily digested forms of the casein (milk protein), and releases free amino acids.
Yogurt is also a recognized as a source of calcium and may provide other micronutrient in small amount: vitamin A, riboflavin, vitamin B5, vitamin B12, potassium, zinc, phosphorus, magnesium, and in some countries, vitamin D (7).
To go further, as a diet does not consist of the ingestion of single nutrients, it is interesting to study the effect of the food structure (9). Indeed, the global food matrix may affect digestion and absorption and generate interactions, which may modify the properties of nutrients. In our case, yogurt, as a living fermented product, possesses unique properties due to the activities of the lactic acid bacteria. Yogurt is known to have potential effects on the gut microbiota and the intestinal barrier function and it can contribute event to cardiometabolic benefits. Studies show also that the yogurt matrix may have a role on appetite and glycaemic control.
Finally, several studies amongst different groups of population link the regular consumption of yogurt to better nutrient intakes. It seems indeed, that yogurt consumers tend to make other more nutrient-rich food choices and have a healthy lifestyle (10)
For more information, discover our dedicated infographic: switching to nutrient-rich foods for an healthier diet.
Sources:
[1] Drewnowski A, Fulgoni VL; Nutrient density: principles and evaluation tools; Am J Clin Nutr
[2] Darmon N et al. Nutrient profiles discriminate between foods according to their contribution to nutritionally adequate diets: a validation study using linear programming and the SAIN, LIM system. Am J Clin Nutr. 2009. 89(4);1227-36
[3] Bos C et al. Nutritional and physiological criteria in the assessment of milk protein quality for humans. J Am Coll Nutr. 2000 ; 19 (2 Suppl) : 191S-205S
[4] Dietary Guidelines for Americans, 2010.
[5] Fumeron F et al. Dairy consumption and the incidence of hyperglycemia and the metabolic syndrome: results from a French prospective study. Data from the Epidemiological Study on the Insulin Resistance Syndrome (DESIR). Diabetes Care 2011 ; 34 (4) : 813-7
[6] Drewnowski A. Concept of a nutritious food: toward a nutrient density score. Am J Clin Nutr. Oct 2005; 82 (4) : 721-32
[7] Gaucheron F. Milk and dairy products: a unique micronutrient combination. J Am Coll Nutr. 2011; 30 (5 Suppl1) : 400S-9S
[8] French food composition table, Table Ciqual 2008.
[9] Kongerslev Thorning T. et al. Whole dairy matrix or single nutrients in assessment of health effects: current evidence and knowledge gaps. Am. J Clin. Nutr. 2017, 105 (5) : 1033-1045
[10] Tremblay A and Panahi S. Yogurt Consumption as a Signature of a Healthy Diet and Lifestyle, Journal of Nutrition 2017;147:1S-5S.