This Digest is all about the #NutritionalValue of #DairyProtein in #Yogurt
We’ve heard since school days that protein is needed for growth and development. But there’s more to this macronutrient than meets the eye. Protein is an essential nutrient that plays a vital role not only in growth, repair and development, but also in immunity, and the health of bones, muscles, skin, and nerves (1).
Amino acids are the building blocks of protein. Of the 20 or so used by the body, 9 are considered “essential” or “indispensable” – those that the human body can’t manufacture on its own – and must be obtained from the diet. High quality proteins contain all 9 essential amino acids in the proportions that cells need for protein synthesis. In contrast, lower quality proteins are missing or low in one or more essential amino acids – referred to as ‘limiting amino acids’. The digestibility of a protein is also an important aspect of its quality (2) (3).
Protein quality measurement is an assessment of the ability of a dietary protein source to fulfill our body’s requirement for indispensable (or essential) amino acids. Not all proteins are equal – quality can make a difference. The better the score, the better the protein meets our body’s needs.
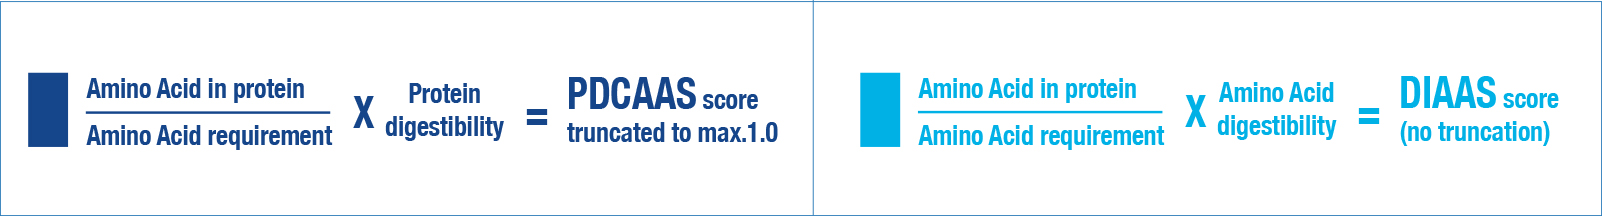
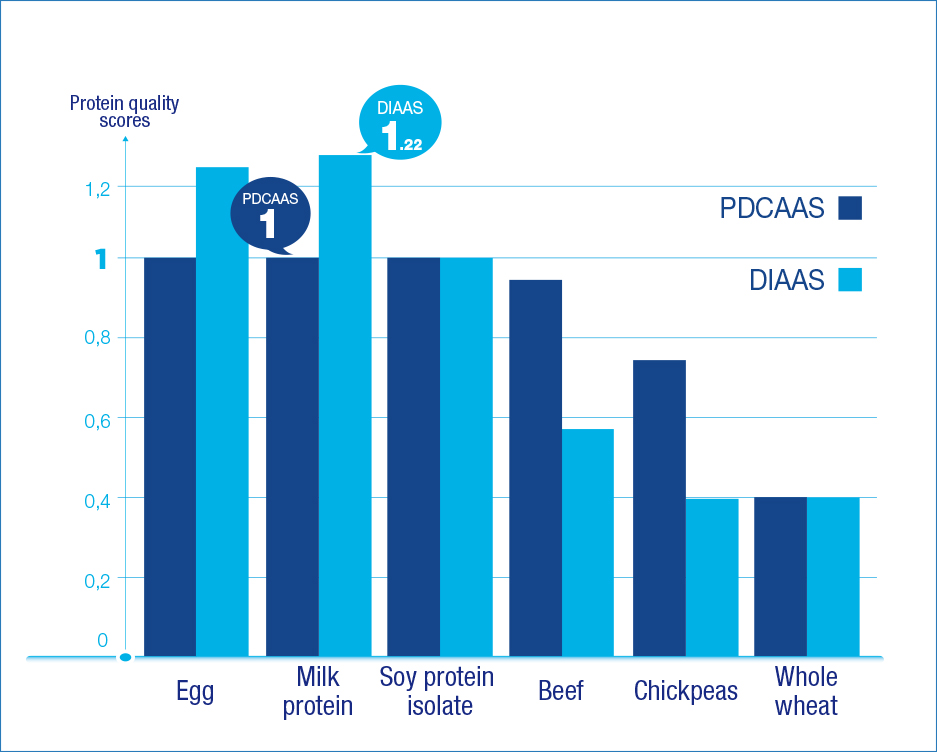
There are several methods for rating protein quality. Currently, the most widely used method is the Protein Digestibility-Corrected Amino Acid Score (PDCAAS), which rates proteins from 0 to 1.0 (1 represents the highest). With this method, whole wheat has a score of 0.40, and cow’s milk 1.0 (4).
Recently the Food & Agriculture Organisation (FAO) recommended using the Digestible Indispensable Amino Acid Score (DIAAS) because it more accurately measures protein quality and the body’s ability to absorb essential/indispensable amino acids e.g. it can measure digestibility of individual amino acids rather than the crude protein levels measured by PDCAAS (5).
A key difference is that unlike PDCAAS, DIAAS scores may be greater than 1.0 (or 100%) if the protein contains a relatively high content of indispensable amino acids e.g. milk powder has a DIAAS of 1.22, whey protein isolate of 1.25, milk protein concentrate of 1.31, soy protein isolate of 1.00, peas 0.64, and wheat 0.4 (5).
The high PDCAAS and DIAAS for milk indicates that dairy proteins are well digested and absorbed (good bioavailability), and its mix of amino acids (including all of the 9 essential amino acids), supports efficient protein synthesis. A DIAAS over 100% for an individual food (high protein quality food such as milk) also indicates its potential to complement the protein contribution of a food with a lower DIAAS value, namely a food such as cereal or vegetable protein, of lower protein quality and therefore with a ‘limiting’ amino acid (5).

References:
- First Global Summit on the Health Effects of Yogurt. 2014, Am J Clin Nutr, p. 99(suppl):1203S.
- Tome D. Criteria and markers for protein quality assessment – a review. Br J Nutr. 2012; 108 Suppl. 2: S222-9.
- Boye J, Wijesinha-Bettoni R, Burlingame B. Protein quality evaluation twenty years after the introduction of the protein digestibility corrected amino acid score method. Br J Nutr. 2012; 108 Suppl. 2: S183-211
- Protein quality evaluation : report of the joint FAO/WHO expert consulation, FAO Food and Nutrition Paper No. 51, 1989.
- Protein quality evaluation in human nutrition. FAO Food and Nutrition Paper No. 92. 2013.http://www.fao.org/ag/humannutrition/35978 02317b979a686a57aa4593304ffc17f06.pdf.
Protein in yogurt has higher digestibility
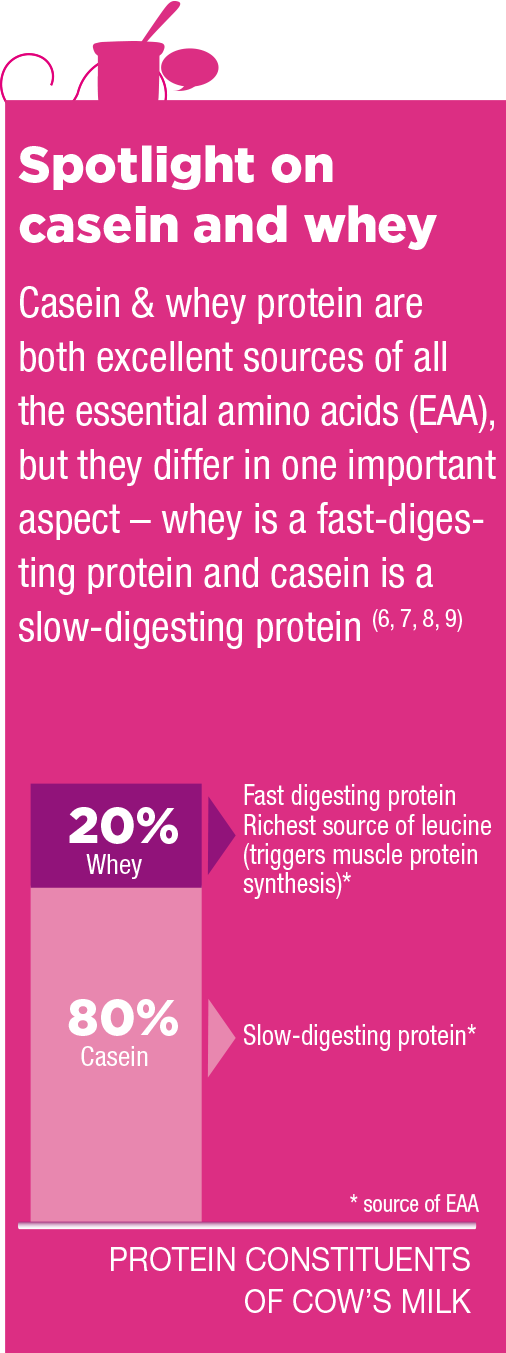
Milk and yogurt are excellent sources of high quality protein, which is roughly made up of 80% casein and 20% whey protein. The high nutritional value of milk proteins is well preserved during the fermentation process involved in yogurt production. The protein content of yogurt is generally higher than that of milk because of the addition of non-fat dry milk during production (10). Proteins in yogurt have been found to be more digestible than proteins in unfermented (standard) milk.
Both the heat treatment and acid production involved in fermentation appear to start breaking down milk proteins, producing smaller, more easily digested forms of the milk protein casein, and releasing some free amino acids into yogurt (10). Cultured yogurt also has a higher protein quality than the mix it is made from (10).
References:
6. Moore DR, Robinson MJ, Fry JL, Tang JE, Glover EI, Wilkinson SB, Prior T, Tarnopolsky MA, Phillips SM. Ingested protein dose response of muscle and albumin protein synthesis after resistance exercise in young men. Am J Clin Nutr. 2009;89:161–168.
7. Tang JE, Moore DR, Kujbida GW, Tarnopolsky MA, Phillips SM. Ingestion of whey hydrolysate, casein, or soy protein isolate: effects on mixed muscle protein synthesis at rest and following resistance exercise in young men. J Appl Physiol. 2009;107:987–99.
8. Pennings B, Boirie Y, Senden JM, Gijsen AP, Kuipers H, van Loon LJ. Whey protein stimulates postprandial muscle protein accretion more effectively than do casein and casein hydrolysate in older men. Am J Clin Nutr. 2011;93:997–1005.
9. Wilkinson SB, Tarnopolsky MA, Macdonald MJ, Macdonald JR, Armstrong D, Phillips SM. Consumption of _uid skim milk promotes greater muscle protein accretion after resistance exercise than does consumption of an isonitrogenous and isoenergetic soy-protein beverage. Am J Clin Nutr. 2007;85:1031–1040. 10. Adolfsson O, Meydani SN, Russell RM. Yogurt and gut function. Am J Clin Nutr. 2004; 80(2):245-56.
Yogurt Benefits for Lactose Intolerance
There appears to be a growing trend for people, particularly women, to self-diagnose lactose intolerance. Regardless of whether a diagnosis is correct or not, it is often wrongly assumed that sufferers cannot tolerate yogurt. Lactose is a type of sugar found in milk. Lactose intolerance occurs when there isn’t enough of the enzyme lactase available in the gut to digest lactose. This leads to undigested lactose passing into the large intestine where it can be fermented by the bacteria in the colon causing unpleasant symptoms, such as flatulence, diarrhoea and abdominal pain. As a result, people with lactose intolerance may avoid all dairy products; putting their intake of vital nutrients at risk.
Research has consistently shown that most people with lactose intolerance can better tolerate yogurt compared to standard/unfermented milks (11) (12) (13), meaning that nutrient dense yogurt can still be included in the diet and people will have the health benefit of high quality protein from dairy. There appears to be a number of possible reasons for this including the activity of live bacteria in the yogurt (10) (14).
References:
10. Adolfsson O, Meydani SN, Russell RM. Yogurt and gut function. Am J Clin Nutr. 2004; 80(2):245-56.
11. Scientifc Opinion on the substantiation of health claims related to live yoghurt cultures and improved lactose digestion (ID 1143, 2976) pursuant to Article 13(1) of Regulation (EC) No 1924/2006.
12. Rosado JL, Solomons NW, Allen LH. Lactose digestion from unmodi_ed, low-fat and lactose-hydrolyzed yogurt in adult lactose maldigesters. Eur J Clin Nutr 1992;46:61–7.
13. Kolars JC, Levitt MD, Aouji M, Savaiano DA. Yogurt—an autodigesting source of lactose. N Engl J Med 1984;310:1–3.
14. Savaiano DA, AbouElAnouar A, Smith DE, Levitt MD. Lactose malabsorption from yogurt, pasteurized yogurt, sweet acidophilus milk, and cultured milk in lactase-de_cient individuals. Am J Clin Nutr 1984;40:1219–23.
Is dairy protein in the form of yogurt a more nutritious choice?
It’s fair to say that we would probably be a healthier population if we ate more nutrient-rich foods. Nutrient density is typically described as a measure of the positive nutrients provided per calorie of food. Nutrient-dense food choices, therefore, provide a high proportion of positive nutrients relative to calories, helping people to meet their nutritional requirements without encouraging weight gain. Nutrient-dense foods are the opposite of “empty-calorie“ foods (15).
Energy density is the amount of energy (calories) per gram of food. Foods with a high water content tend to have a lower energy density e.g. vegetables, low fat yogurt, milk and fruit. Foods with a lower energy density provide fewer calories per gram compared to high energy-dense foods, so a greater weight of the food can be eaten whilst still helping to keep calorie intake in check (15).
A number of studies amongst different age and population groups (16) (17) link better nutrient intakes, for example, of protein, calcium, magnesium, zinc, vitamin D and riboflavin, and higher overall diet quality with increased intake of dairy foods including yogurt.
People who choose more dairy foods, also tend to make other more nutrient-rich food choices (16). Eating yogurt is a good marker of diet quality (17). Compared to non-consumers, yogurt consumers:
- Were nearly twice as likely to have a healthier dietary pattern as non-consumers.
- Had higher potassium intakes and were less likely to have inadequate intakes of riboflavin, vitamin B12, calcium, magnesium, and zinc (17).
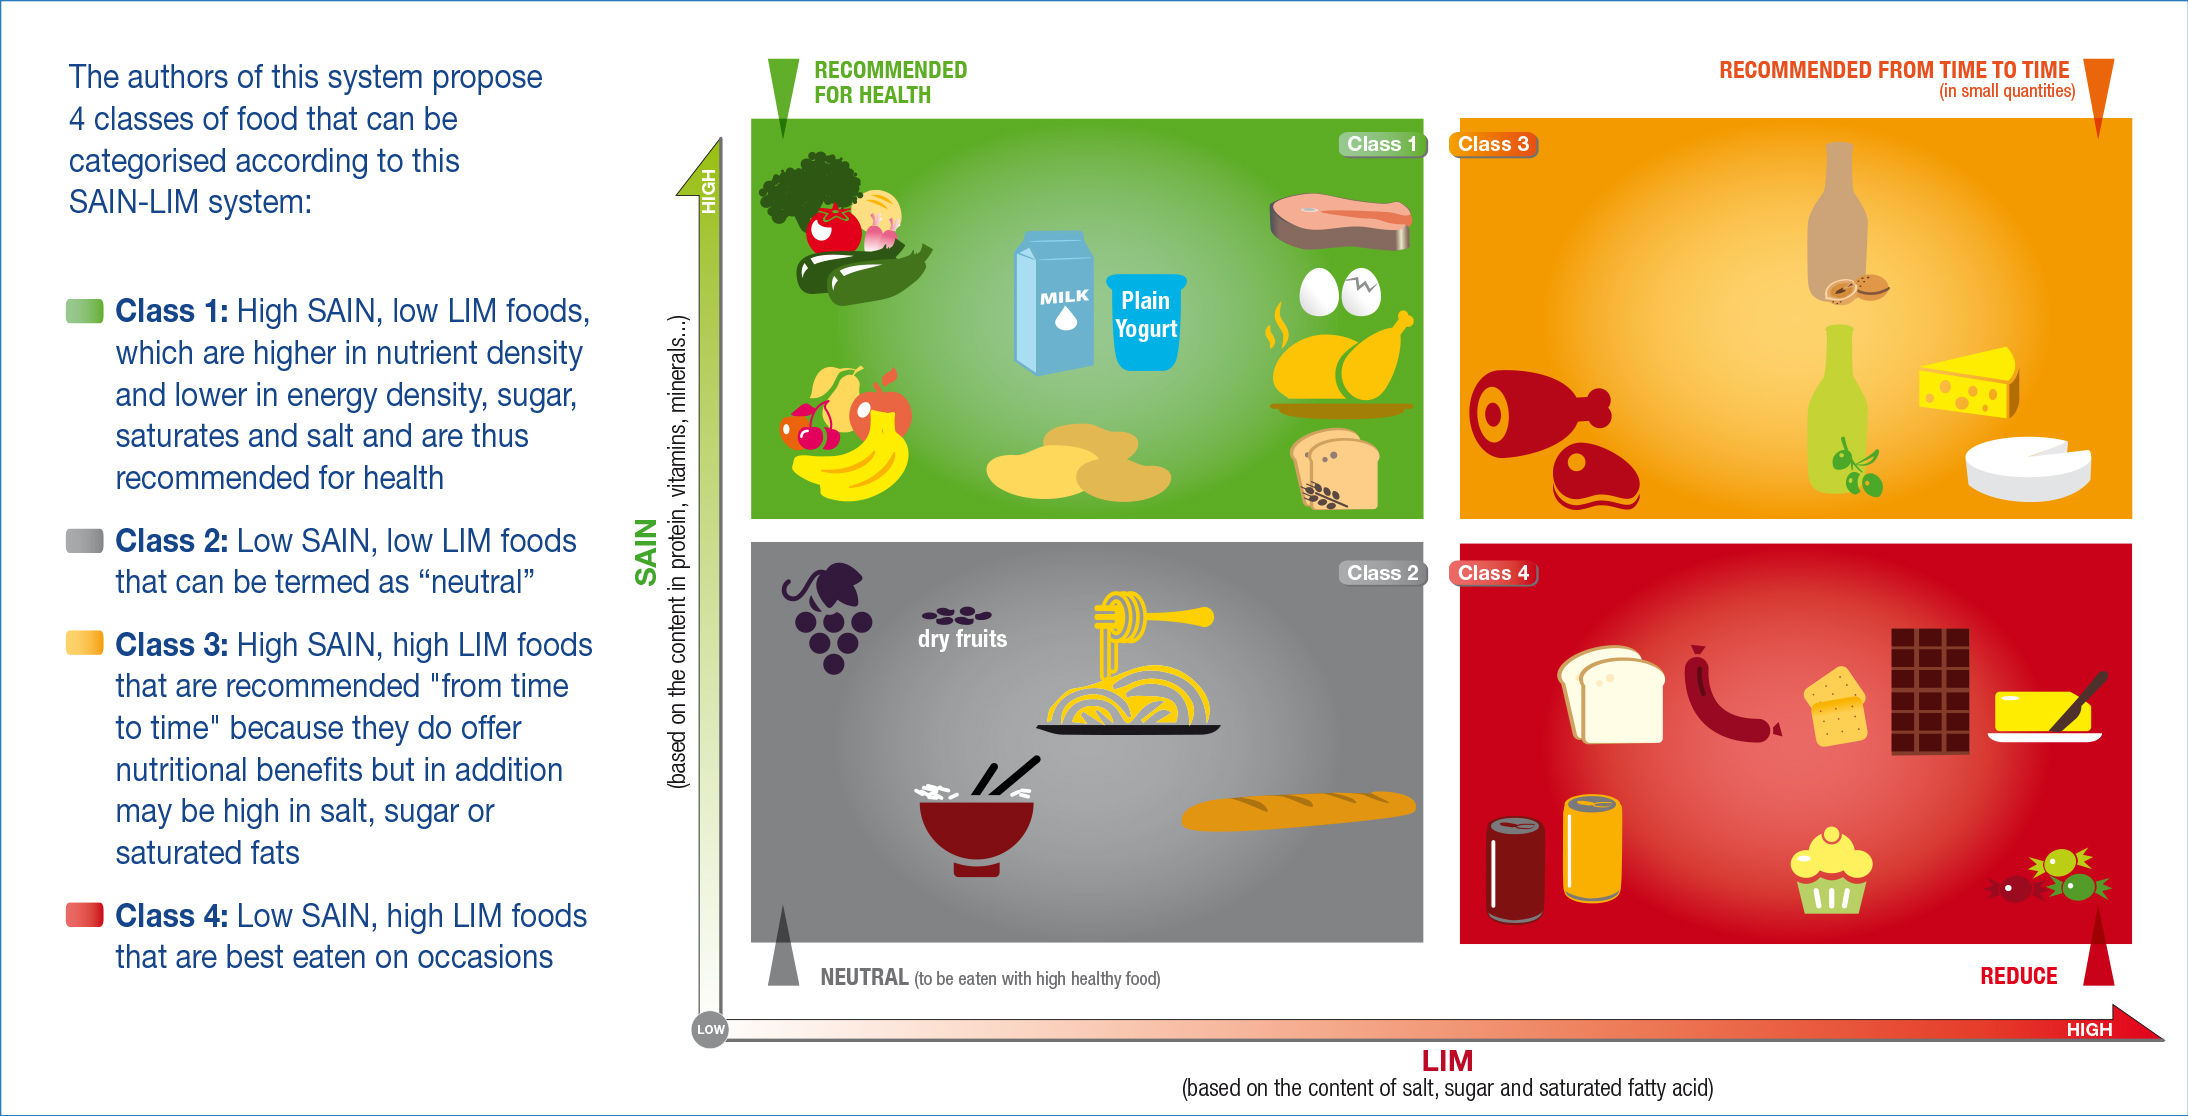
Nutrient profiling systems such as the SAIN/LIM system may help to identify foods of good nutritional quality. This system (15) is based on 2 independent scores :
- The SAIN (a marker of nutrition) is a score of nutritional adequacy based on the content of 5 nutrients : protein, fibre, ascorbic acid, calcium, and iron + 4 potential optional nutrients when needed.
- The LIM score is the mean percentage of the maximum recommended values for 3 nutrients, the intakes of which should be limited in a healthy diet : saturated fats, added sugars and salt.
So a high SAIN score represents more nutrient-rich foods, whereas a high LIM score represents more unhealthy aspects of the food.
References:
15. Darmon N, Vieux F, Maillot M, Volatier JL, Martin A. Nutrient profiles discriminate between foods according to their contribution to nutritionally adequate diets: a validation study using linear programming and the SAIN,LIM system. Am J Clin Nutr. 2009. 89(4);1227-36,
16. Weinberg LG, Berner LA, Groves JE. Nutrient contributions of dairy foods in the United States, Continuing Survey of Food Intakes by Individuals, 1994-1996, 1998. J Am Diet Assoc. 2004; 104(6):895-902.
17. Wang H, Livingston KA, Fox CS, Meigs JB, Jacques PF. Yogurt consumption is associated with better diet quality and metabolic profile in American men and women. Nutr Res. 2013; 33(1):18-26.
Dairy protein: Why is it recommended worldwide?
Dairy foods provide high quality protein wrapped up in a robust nutrient package, and a regular intake can be a marker for diet quality. Most countries recommend consumption of dairy products; and when amounts are specified, 2 or 3 servings per day are typically recommended (18). Dietary guideline recommendations for dairy products are based partly on culture and availability, but the key reason is for meeting nutrient requirements (18).
- For example, amongst US adults, the 2003-2006 National Health and Nutrition Examination Survey (NHANES) found that milk was the 4th highest ranked food source of protein, and the highest ranked food source of calcium (22.5%), vitamin D (45.1%), and potassium (9.6%) (19) (20).
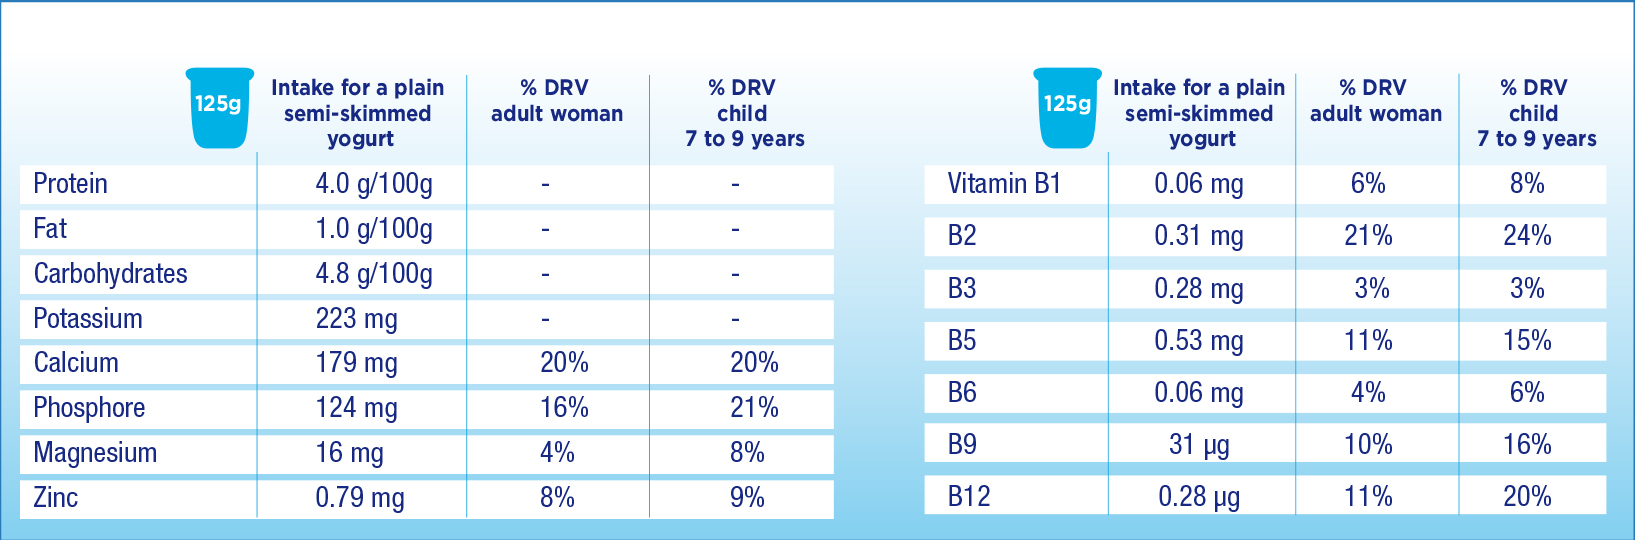
- In France, 125ml of natural yogurt provides, amongst other nutrients, 20% of calcium, 21% of vitamin B2, 11% of vitamin B12, 16% of phosphorus of an adult’s recommended daily intakes (21) (22).